


Have you ever been confused on how to start with a technical analysis of a stock, index, commodities, Currency etc.? This article aims at solving the puzzle.
First of all, Technical analysis isn’t the only way, there are fundamentalists too. But fundamental analysis tends to lag because, Fundamentalist studies the cause of the market movement, and Technician studies the effect.
Let’s define Technical Analysis: The study of market action, primarily through the use of charts, for the purpose of forecasting future price trends is Technical Analysis.
Market Action includes: Price, volume and open interest
There are three assumptions on which the Technical Analysis is based:
- Market action discounts everything
- Prices move in trends
- History repeats itself
Myth: Fundamental analysis is good for longer horizon (long term trading aka BUY and HOLD) while technical analysis is superior on the shorter terms (positional trading), but this isn’t the case.
Myth-buster: Technical analysis is a great tool for all time horizons. Let it be a 3 minute move or a 30 year chart. The same don’t apply to fundamentals. Fundamentals factor the financial performance of the company to arrive at the intrinsic value, and if that value is more than the Current Market Price, the market is undervalued and should be bought and vice versa. Fundamentals don’t change on 3 minute basis. They change only when the latest quarterly numbers change the valuation of a company, or if there is any corporate announcement.
Some criticisms of The Technical Approach:
- Self-Fulfilling Prophecy: They say, chart patterns are already known to traders since 30+ years now, and they can now trade according to the bullish or bearish indicators, which creates a “self-fulfilling prophecy” as the waves of selling or buying are generated in response to bearish or bullish indicators.
The counter argument: Chart patterns are completely subjective. A buying for Mohan can be the point where Sohan is selling his stocks which he held for many years. No study has mathematically quantified proved the complete charting. Because it is literally in the mind of the beholder ☺
- Can the past tell us about the future?: Statistics is sub divided in 2 types
- Descriptive: referring to graphical representation of data i.e. price data on bar, candlesticks.
- Inductive: Generalisation, predictions or extrapolations which are inferred from the data.
The Price chart itself comes under the Descriptive side, but the so-called analysts who take the trades and represent the market participants are from the Inductive side. Hence, even though is seems less likely that the chart repeats themselves, but Market is a group of people trading, and where there are humans, the behaviours repeat in a similar fashion for a similar event. Hence the market crashes are always ruthless, and huge.
Dow the original WOW!
Most technicians who follow the trends and patterns today are in one or the other way the derivative of the theory first proposed by Dow.
Basic Tenets of Dow Theory:
- The average discounts everything
- The markets has three trends: Primary, Secondary and Minor
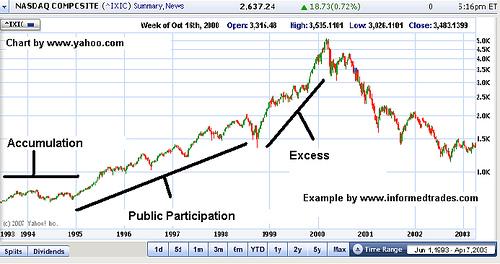
- Each Trend has three phases: Accumulation, Public Participation, Distribution phase
- The Averages Must Confirm each other
- Volume must confirm the trend
- The trend is assumed to be continued until it gives definite signals that it has reversed.
Criticisms of Dow Theory:
On average, Dow Theory misses 20 to 25% of the move before generating the signal. Many of them consider this as “Late”.
But Traders should remember that Dow never intended to anticipate trends, but was interested to find Bull/Bear trends and to capture the large middle portion of important market moves.
…to be continued.
1 comments:
This was a great read. Can we have the second part soon?
Post a Comment